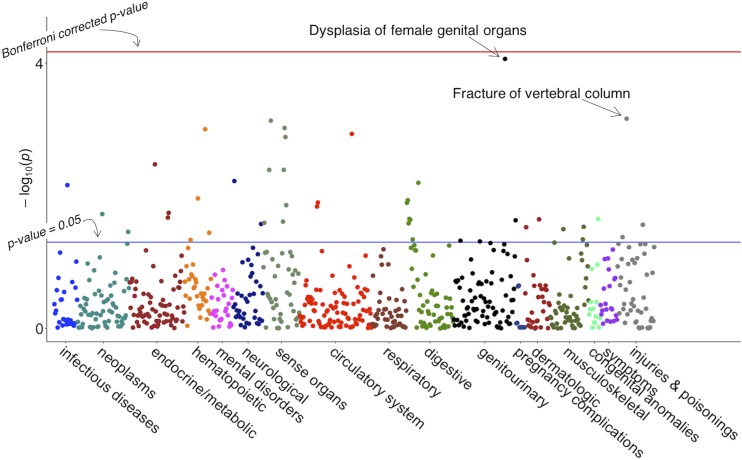
Figure 1.
Manhattan Plot of PheWAS for rs121918007. This figure represents 742 phenotypes tested for association with SNP rs121918007, using logistic regression, assuming an additive genetic model adjusted for age, sex, and batch. Phenotypes are grouped along the x-axis by categorization within the PheWAS code hierarchy. The upper-red line indicates Bonferroni correction P = 6.7 × 10⁻⁴ (false discovery rate = 0.1 for entire PheWAS); lower blue lines indicate P = 0.05.

