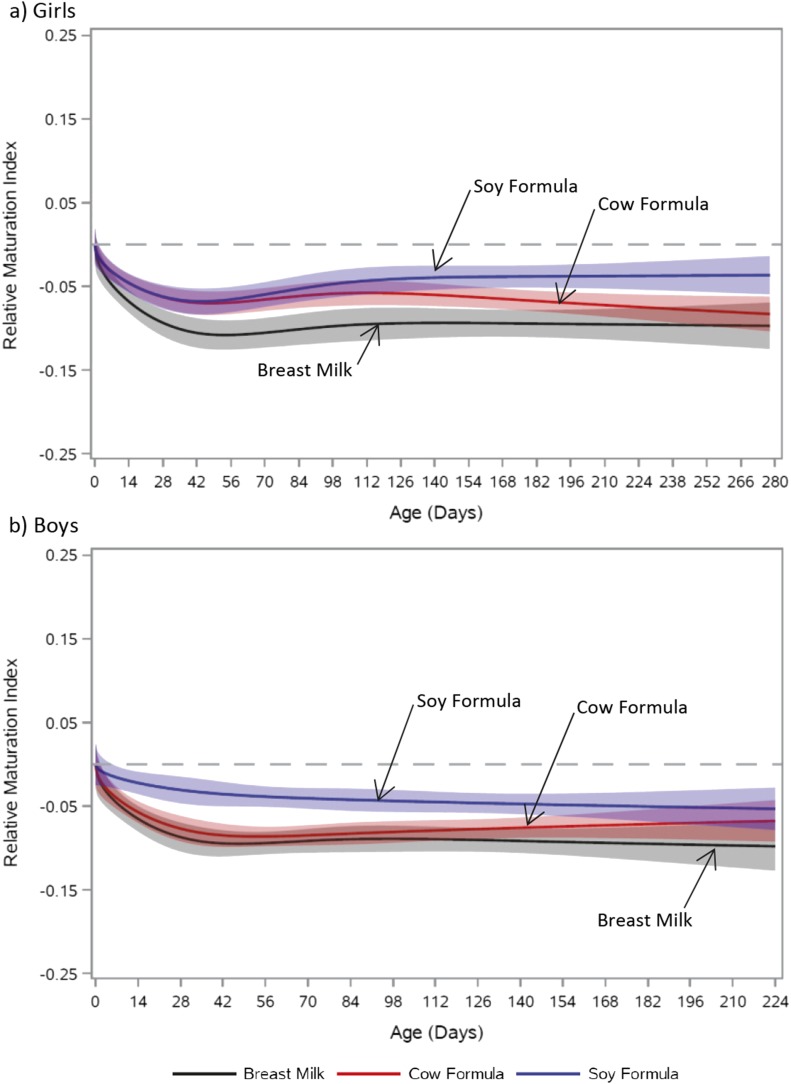
Figure 1.
Relative trajectory of MI vs age by feeding group. (a) Girls: soy formula vs cow-milk formula, P = 0.01; soy formula vs breast milk, P = 0.01; breast milk vs cow-milk formula, P = 0.23. (b) Boys: soy formula vs cow-milk formula, P = 0.08; soy formula vs breast milk, P = 0.10; breast milk vs cow-milk formula, P = 0.67. Feeding-group–specific trajectories fitted to data were shifted vertically to a common intercept at zero (dashed line) to better display postnatal changes (i.e., fitted MI at a given age minus fitted MI at birth). Thus, the vertical axis represents change in MI since birth. Shaded bands represent 95% pointwise confidence limits for each feeding-group–specific trajectory. Absolute trajectories (i.e., those without vertical shift to common intercept) are shown in Supplemental Fig. 2.

