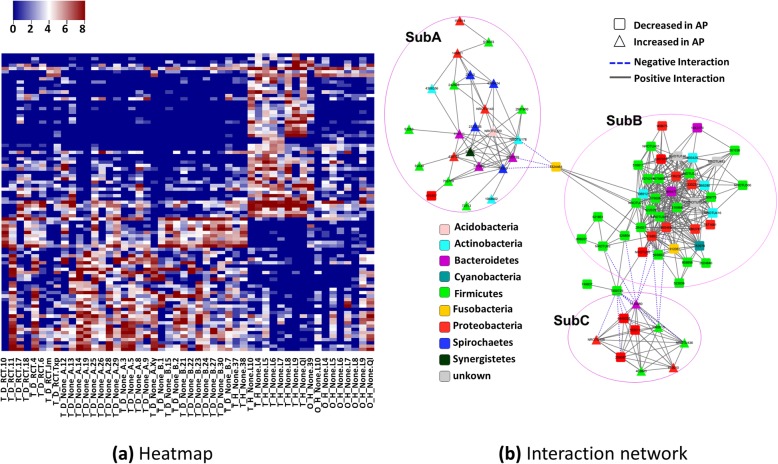
Fig. 5.
Heatmap and their interactions of the key OTUs identified through comparison between AP (NRCT) and health control (HT). a heatmap of the key OTUs across all 50 samples. b Interaction network of the key OTUs is constituted with two parts: SubA, where increased OTUs are inter-connected; SubB, where decreased OTUs are inter-connected; SubC: increased and decreased OTUs interacted

