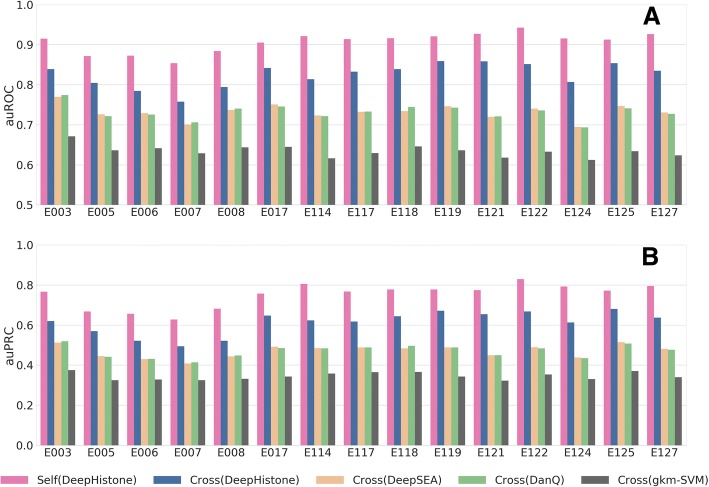
Fig. 4.
Cross cell line prediction. Each bar indicates the mean of auROC (a) or auPRC (b) of 7 histone modification markers in a certain epigenome. “Self (DeepHistone)” indicates the performance of an epigenome predicting by a DeepHistone model trained in the same epigenome. “Cross (DeepHistone)” indicates the performance of cross epigenomes prediction using DeepHistone model. Others have similar meaning

