Fig. 2.
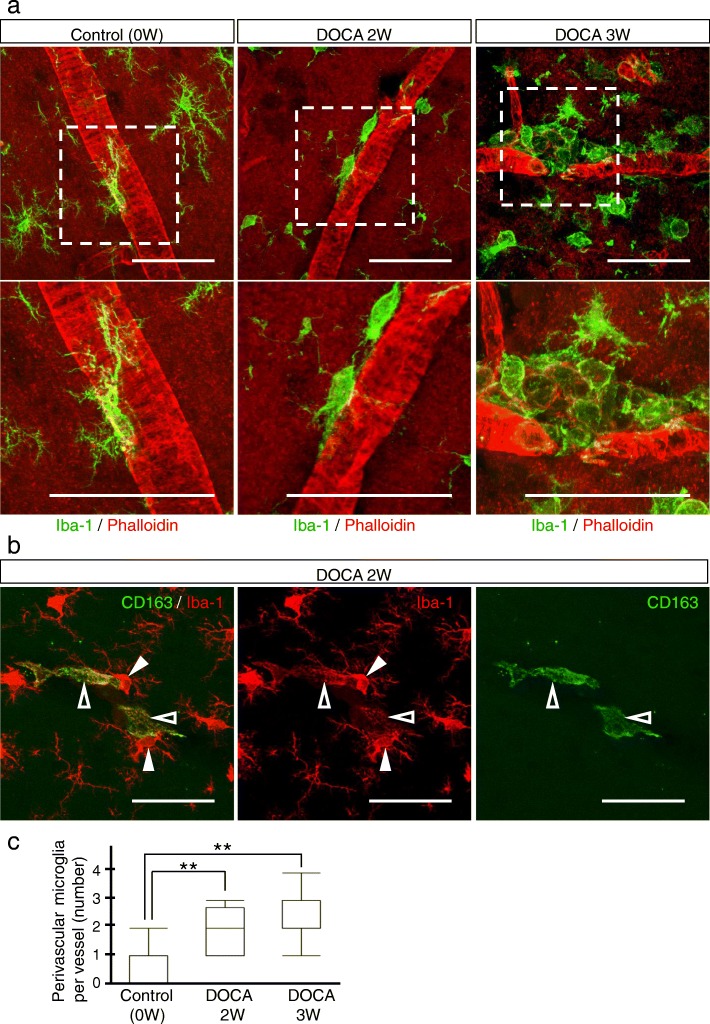
Dynamic morphological changes of microglia in DOCA-salt rats. a Microglia and the cerebral vasculature were visualized by Iba-1 (green) and phalloidin (actin, red), respectively, in the control (left column), DOCA2W (middle column), and DOCA3W (right column). The white dotted square in the upper row was magnified in the lower row. b Perivascular macrophages (CD163-positive cells, green) showed a flattened shape and low expression of Iba-1 (open arrowheads). In contrast, microglia had fine processes and showed high expression of Iba-1 (closed arrowheads). c Perivascular microglia increased in number after DOCA and salt treatments. Significance is expressed as **p < 0.01 using Tukey-Kramer test. Scale bars 50 μm

