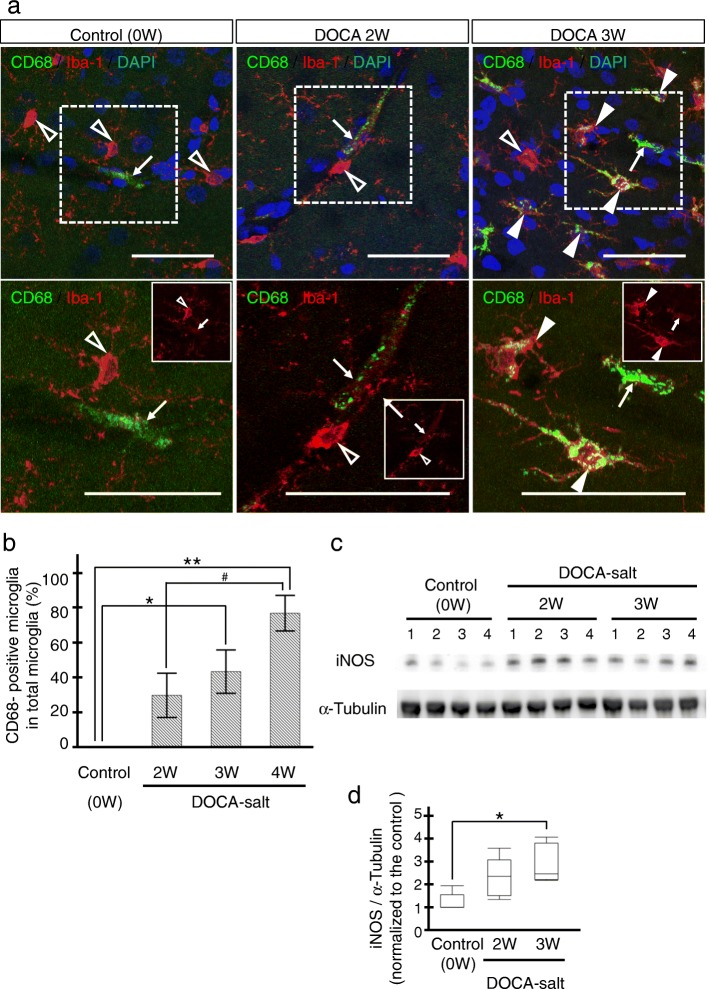
Fig. 3.
M1 switching of microglia in DOCA3W-rats. a Microglia and macrophages were visualized by Iba-1 (red) and CD68 (M1 marker, green), respectively, in the control (left column), DOCA2W (middle column), and DOCA3W (right column). The white dotted square in the upper row is magnified in the lower row. CD68-positive microglia were observed in DOCA3W (closed arrowheads) but not in DOCA2W (open arrowheads). In the white square, only Iba-1 staining was noted. Through the periods, CD68-positive perivascular macrophages existed (arrows). b CD68-positive microglia increased in number in DOCA3W. c, d The expression level of iNOS protein (M1 microglia marker) was increased after DOCA and salt treatment. Significant differences are expressed as *p < 0.05 and **p < 0.01 relative to the control rats and #P < 0.05 relative to DOCA2W using Tukey-Kramer test. The values represent the means ± SEM. Scale bars 50 μm

