Fig. 5.
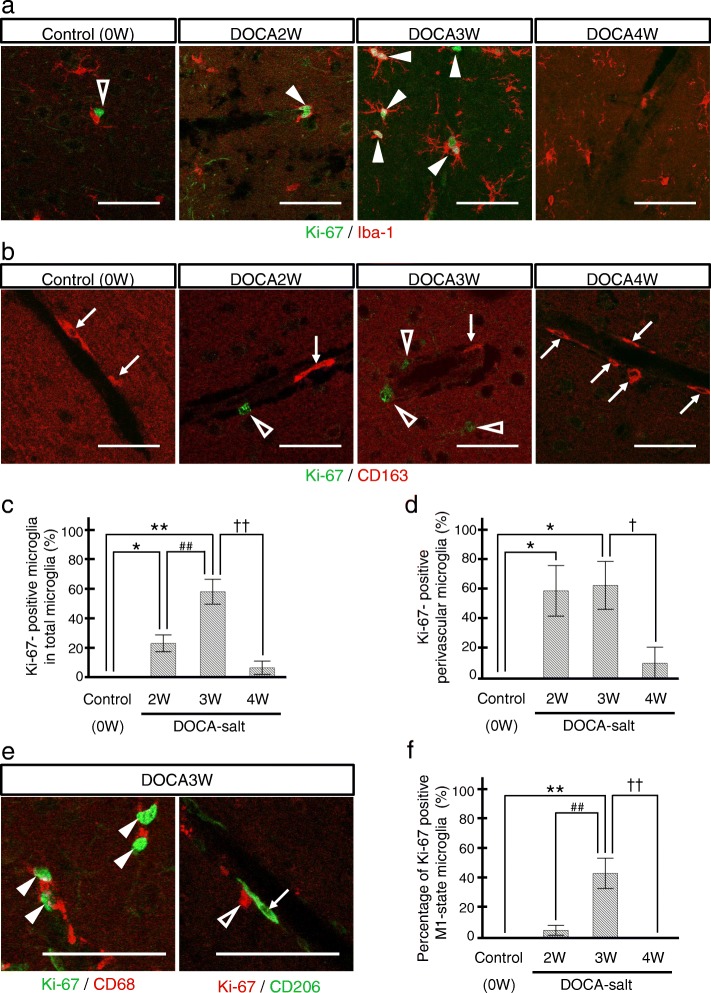
Transient increase of proliferative microglia before M1 switching. a Microglia were visualized by Iba-1 (red) and proliferative cells by Ki-67 (green). Ki-67-positive microglia were increased in DOCA2W and more markedly increased in DOCA3W (closed arrowheads). In DOCA4W, Ki-67-positive microglia were markedly decreased. b CD163-positive perivascular macrophages (red, arrows) were not merged with Ki-67 (green, open white arrowheads) in all stages. c The rate of Ki-67-positive microglia started to increase in DOCA2W. d The rate of Ki-67-positive perivascular microglia became significantly higher in DOCA2W. e In some microglia of DOCA3W, Ki-67 was co-expressed with CD68 but not with CD206. f The rate of proliferative M1-state microglia was significantly higher in DOCA3W. Significant differences are expressed as *p < 0.05 and **p < 0.01 relative to control rats, ##p < 0.01 relative to DOCA2W, and †p < 0.05 and ††p < 0.01 relative to DOCA3W using Tukey-Kramer test. The values represent the means ± SEM. Scale bars 50 μm

