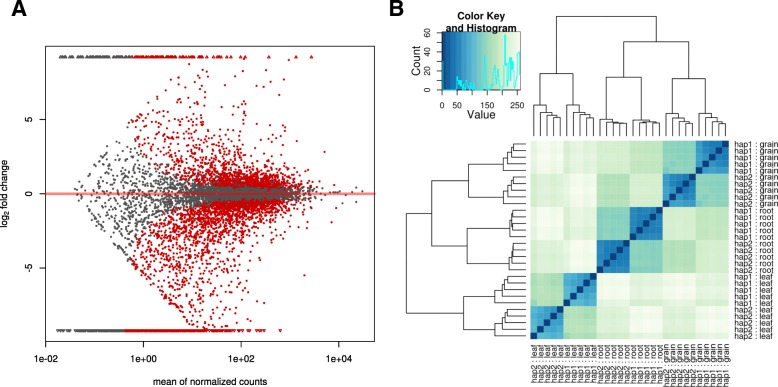
Fig. 4.
Homoeolog-specific expression. a MA-plot of significant differentially expressed homoeologs using GLM fit method. b Sample-to-sample heat map of homoeolog-specific expression similarity. Most of variance is accounted between samples, while a lower fraction is contributed by homoeolog-specific expression (hap1 and hap2). As expected, the five pseudo-replicates showed very high similarity compared to that of homoeologs and tissues (grain, leaf, root) distances

