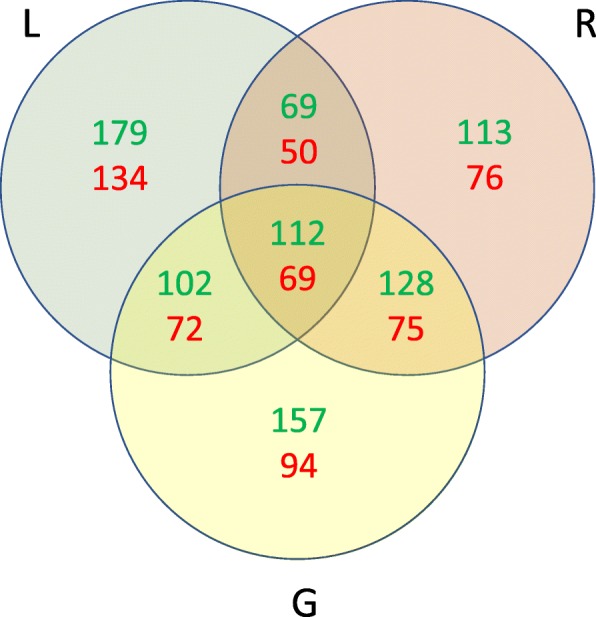
Fig. 5.

Differentially expressed homoeologs within different tissues. Number of differentially expressed homoeologs as identified with negative binomial test, Bonferroni-corrected p-value < 0.01. Tests have been carried between each haplotype pair for a given tissue, (G = grain; L = leaf; R = root). In green is reported genes with over-expression of the A genome, in red those that showed higher expression in the B genome
