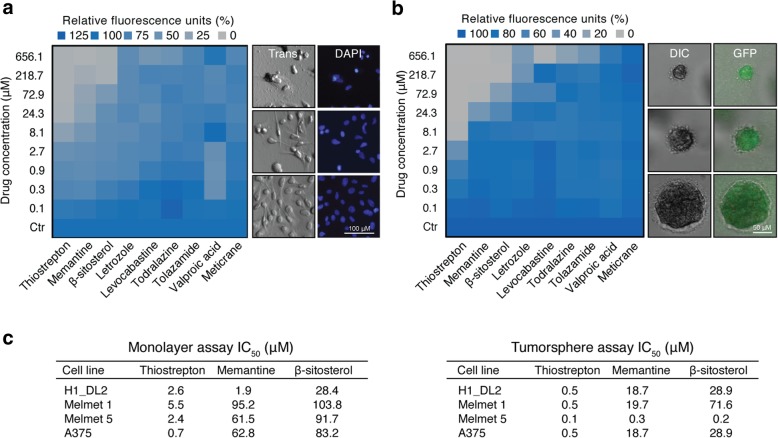
Fig. 2.
In vitro drug screening. a Heatmap of three days H1_DL2 monolayer proliferation assays (left panel) and representative transmission (Trans) and 4′,6-Diamidino-2-Phenylindole (DAPI) images (right panel). b Heatmap of ten days H1_DL2 tumorsphere assays (left panel) and representative differential interference contrast (DIC) and green fluorescent protein (GFP) fluorescence microscopy images (right panel). a-b Right image panels show examples of β-sitosterol 218.7 μM (top), β-sitosterol 2.7 μM (middle) and control (bottom). c Half maximal inhibitory concentration (IC50) values for the three most potent compounds across different cell lines and assays. (a–c) Mean; n = 6 per cell line per drug per drug concentration. See Additional file 4: Figure S3a–c for more details on this experiment

