Fig. 7.
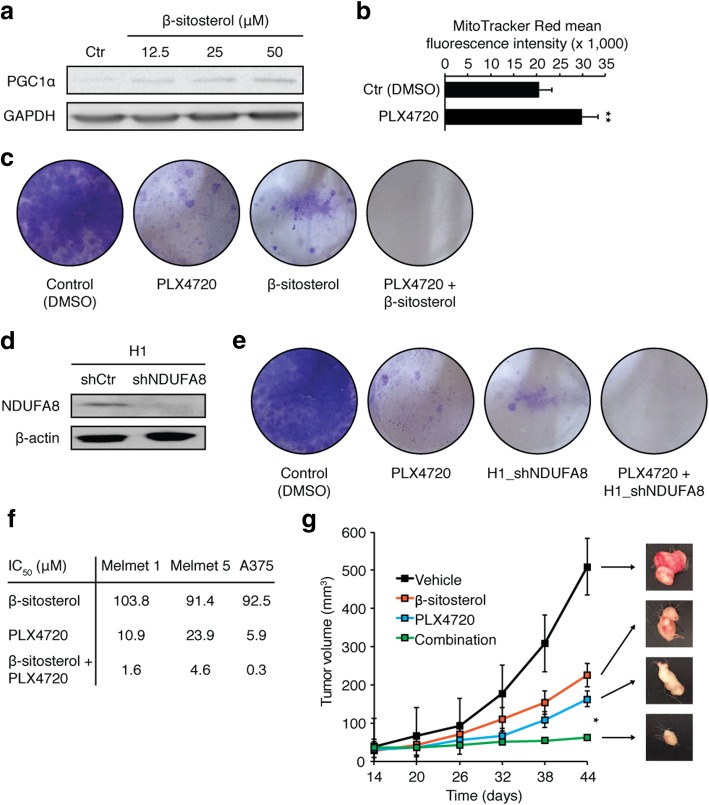
Mitochondrial complex I inhibition prevents BRAFi resistance. a. Western blot of PGC1α and GAPDH in H1 cells treated with DMSO (0.05%) or β-sitosterol (12.5, 25 or 50 μM) for 24 h (n = 3). b. MitoTracker Red mean fluorescence intensity in H1 cells treated with DMSO (0.05%) or vemurafenib (1.5 μM) for 72 h (n = 3). c Colony formation assay (crystal violet staining) of H1 cells treated with DMSO (0.05%) for 1 week, or vemurafenib (1.5 μM), β-sitosterol (50 μM), or vemurafenib + β-sitosterol for 3 weeks (n = 3). d Western blot of NDUFA8 and β-actin in H1_shCtr and H1_shNDUFA8 cells (NDUFA8 is required for assembly of a functional complex I). e Colony formation assay of H1 cells treated with DMSO (0.05%) for one week or vemurafenib (1.5 μM) for three weeks, and H1_shNDUFA8 cells alone or treated with vemurafenib (1.5 μM) for three weeks (n = 3). f Half maximal inhibitory concentration (IC50) values for β-sitosterol, PLX4720 and the combination thereof in Melmet 1, Melmet 5 and A375 cell lines (n = 3). g Subcutaneous tumor volume (width2 × length)/2) in mice injected with 1 × 10⁶ Melmet 5 cells. Mice were from two weeks onwards given daily i.p. injections of 0.1 mL vehicle (olive oil), 20 mg/kg β-sitosterol in olive oil, 25 mg/kg PLX4720 in 0.05% DMSO, or a combination of the two latter (n = 8 in each group). Representative images of tumors at 44 days are shown in the right panel. Student’s t-test: * P < 0.05. Values are given as the mean ± s.e.m

