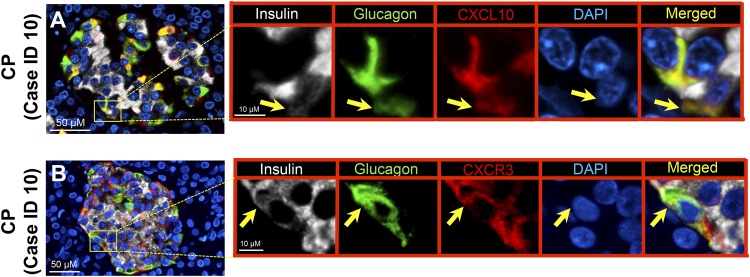
Figure 6.
Expression of chemokine (CXCL10) and its receptor (CXCR3) in α-β double-positive cells. Representative merged images showing (A) coexpression of insulin-glucagon-CXCL10 and (B) insulin-glucagon-CXCR3 in subjects with CP. Insets: Higher magnification of the indicated region in the low-power images, with arrows indicating (A) the cells that express insulin (white), glucagon (green), CXCL10 (red), 4′,6-diamidino-2-phenylindole (DAPI) (blue), and merged (yellow) and (B) insulin (white), glucagon (green), CXCR3 (red), DAPI (blue), and merged (yellow). Scale bar, 50 μm in lower-power views, 10 μm in insets.

