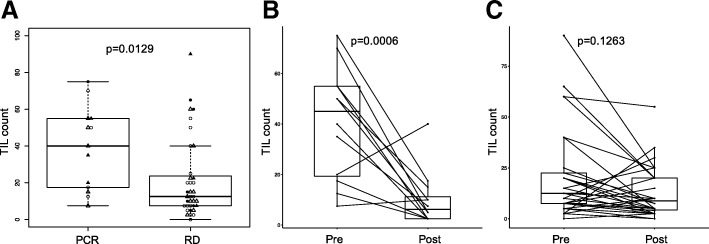
Fig. 1.
Tumor infiltrating lymphocyte (TIL) counts in cases with pathologic complete response (pCR) and residual disease (RD), and in pre- and post-treatment samples. a Box plots of baseline TIL counts in cases with pCR and RD. Triangles and dots/circles represent patients in the bevacizumab and control arms, respectively. Open and dark symbols indicate estrogen receptor positive and negative patients, respectively. b Changes in TIL counts in the tumor bed of cases with pCR. c Changes in TIL counts in cases with RD. Paired pre- and post-treatment samples are connected by lines to indicate up or down change in each individual. P values are from Wilcoxon test

