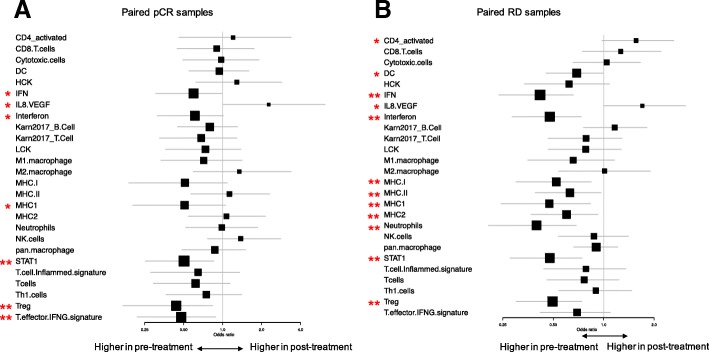
Fig. 6.
Change in immune metagene and immunotherapy response predictive gene signatures before and after treatment in the two response groups. a. Immune gene signature expression changes in pre- and post-treatment samples from pCR cases, represented by odds-ratio and its 95% confidence interval from logistic regression. b. Immune gene signature expression changes in pre- and post-treatment samples from RD cases, represented by odds-ratio and its 95% confidence interval from logistic regression. * indicate a trend with 0.05 < p < 0.1 and ** indicate significance with p < 0.05

