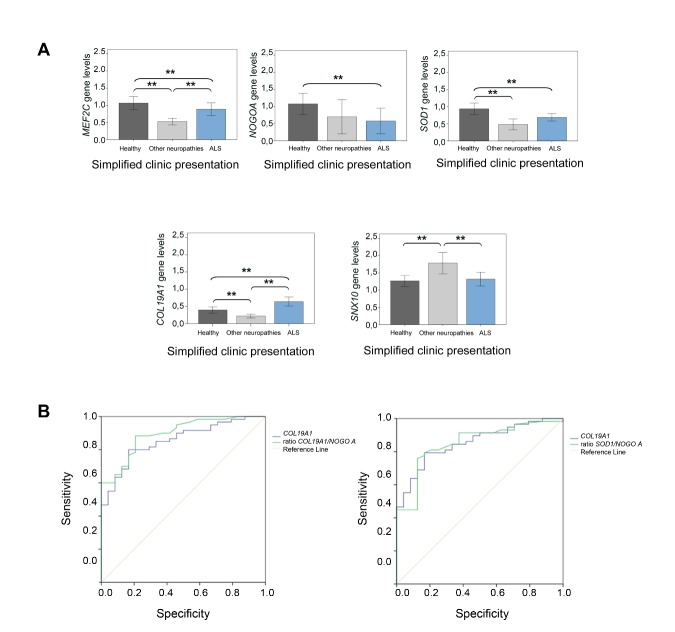
Figure 3.
Relative gene expression analysis in the blood study cohort. Transcriptional expression levels of MEF2C , NOGO A , SOD1 , COL19A1 and SNX10 in healthy subjects, ALS patients and other neuropathies patients. (A) Kruskal Wallis tests showed significant differences among ALS patients and healthy participants in all the cases except for SNX10 . Significant differences among other neuropathies patient group and ALS patient group were found in all the cases except for NOGO A and SOD1 . (B) Area under ROC curves of COL19A1 and the ratios COL19A1 /NOGO A and SOD1 /NOGO A were calculated in the sporadic ALS patient group. Significant differences were found between COL19A1 and the ratio COL19A1 /NOGO A , and between COL19A1 and the ratio SOD1 /NOGO A . A total of 141 participants were included in this study: 58 control individuals, 24 other neuropathology’s individuals and 59 ALS patients (FALS and SALS patients); (*P < 0.05; ** P < 0.001), SE: standard error.

