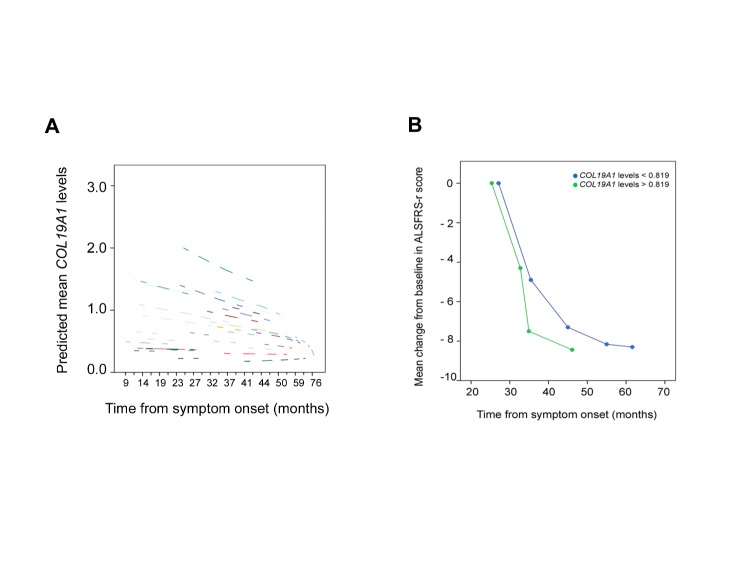
Figure 4.
Linear mixed model analysis in the serial blood study cohort. (A) Linear mixed model analysis showed a significant relationship among a faster disease progression and high COL19A1 levels from symptom onset, each dashed line corresponds to the COL19A1 levels from each patient. (B) Mean change from baseline in the ALSFRS-r score in patients that were monitored at 6-monthly intervals during a follow-up period of 24 months from the symptom onset that show COL19A1 levels above (green dot and line) and below (blue dot and line) average at first evaluation. Student's-t test was performed to analyze statistical differences between groups (P < 0.001). A total of 40 SALS patients from the serial blood study cohort were included.

