
Figure 2. HMGB1 silencing inhibited Ang II-induced HAVSMC phenotype transformation.
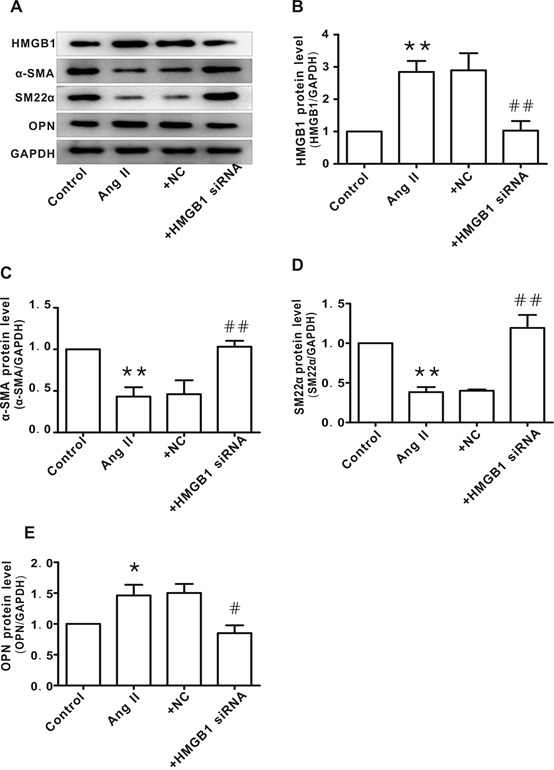
A) Representative images of western blot analysis for HMGB1, α-SMA, SM22α, OPN, and GAPDH. B-E) Protein levels of HMGB1, α-SMA, SM22α, and OPN, respectively. Arbitrary optical density units of the target proteins were normalized to GAPDH and expressed as fold change. *P <0.05, **P <0.01 vs. control group; #P <0.05, ##P <0.01 vs. the Ang II group. At least three independent experiments were performed for each group.