
Figure 3. HMGB1 silencing inhibited HAVSMC migration, proliferation, and cell viability.
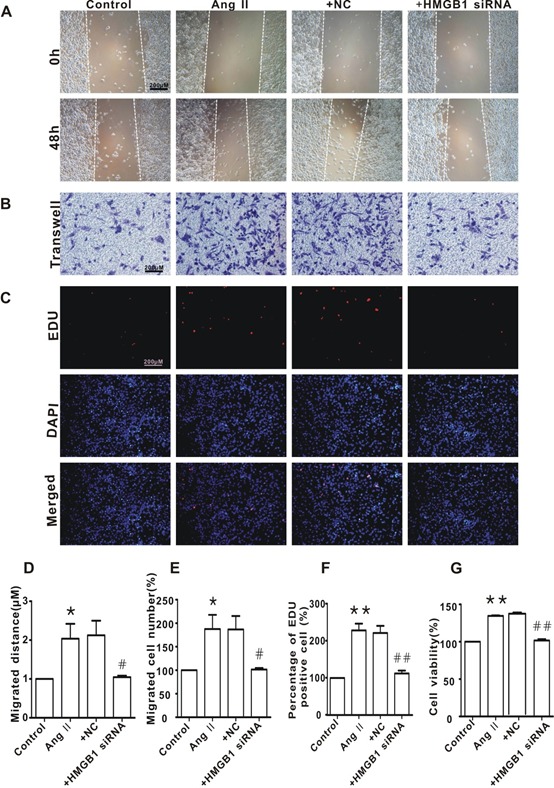
A) Representative images of scratch-wound healing assay (100×). B) Representative images of Transwell assay (100×). C) Representative images of Edu assay (100×). D) HAVSMC migration distance in each group. E. The number of migrated HAVSMCs in each group. F) The percentage of Edu-positive cells in each group. G. Cell viability in each group. *P <0.05, **P <0.01 vs. the control group; #P <0.05, ##P <0.01 vs. the Ang II group. At least three independent experiments were performed for each group.