
Figure 8. Correlation between HMGB1plasma levels and blood pressure.
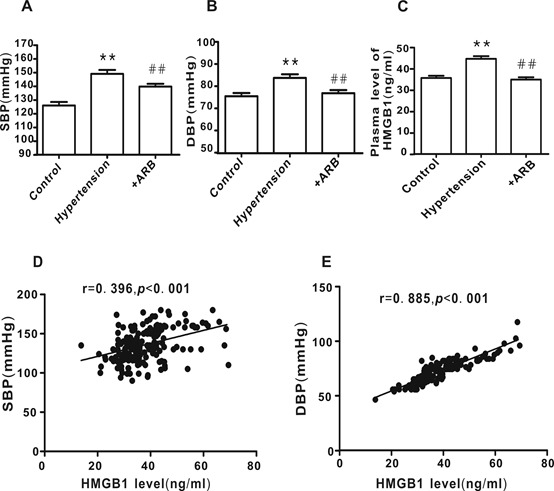
A and B) Subject blood pressure. C HMGB1plasma levels. D and E) Correlation between HMGB1 plasma levels of and blood pressure. Control group, n=58; hypertension group, n=51; +ARB treatment group, n=71. **P <0.01 vs. control, ##P <0.01 vs. hypertension.