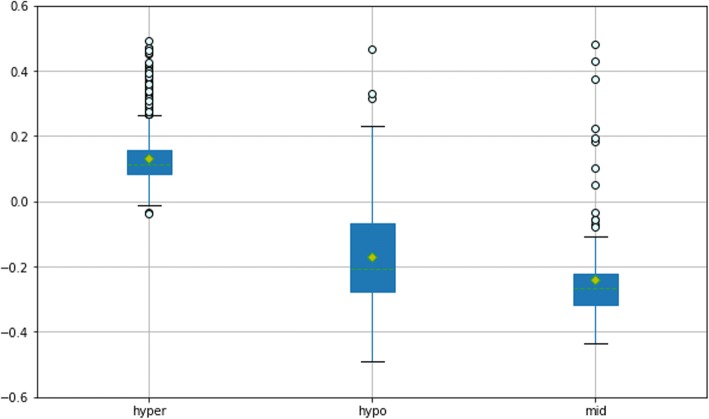
Fig. 2.
MRCNN achieved regression of the whole genome methylation. The box diagrams depict the distribution of the prediction errors of the three groups of sites. The yellow diamonds represent the mean points and the green dotted lines represent the median lines. The points outside the upper and lower boundary lines are the outliers

