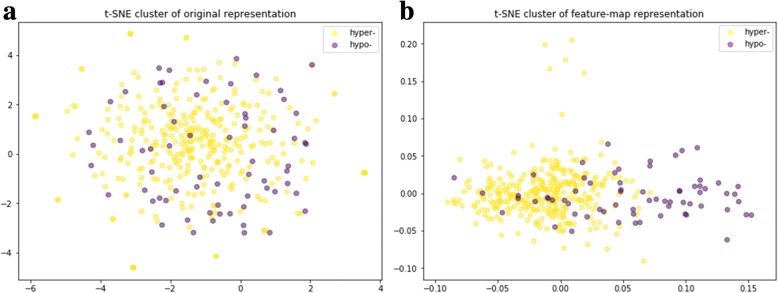
Fig. 5.
Clustering results for hypermethylation and hypomethylation loci of the original features and the learned filters of the first convolutional layer. a t-SNE plot of the original input tensor representation. From the plot, we cannot apparently distinguish between hypermethylation and hypomethylation. b t-SNE plot of the learned feature map representation. Hypermethylation and hypomethylation are generally grouped

