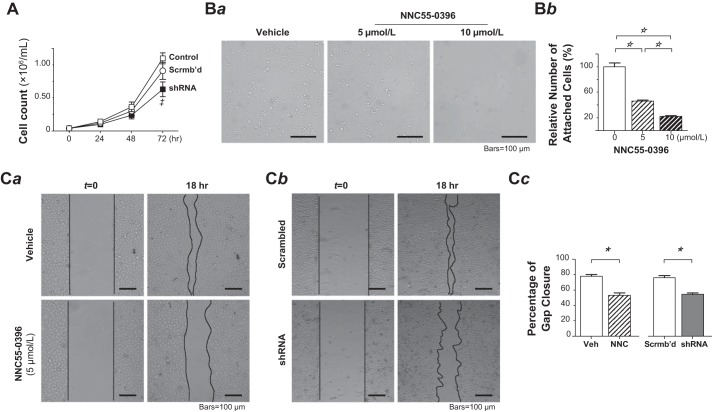
Fig. 4.
T-type Ca2+ channel blockade or α1G-silencing by shRNA reduced pulmonary microvascular endothelial cell (PMVEC) proliferation, cell-matrix interaction, and migration. A: effect of α1G-gene silencing on cell proliferation of PMVECs. Cell growth was observed over a 3-day period in normal (□), scrambled-shRNA-transduced (○), and α1G-shRNA-transduced (■) PMVECs (n = 3 each). The α1G-shRNA transduction reduced the proliferation of PMVECs by 31% at day 3. ‡P < 0.05 relative to scrambled-shRNA-transduced group at the same time point. Two-way ANOVA with Bonferroni’s multiple comparisons test. B: effect of T-type Ca2+ channel blockade on cell-matrix interaction of PMVECs. Ba: representative images of adherent PMVECs remaining on the Matrigel-coated substratum after rinsing with PBS following cell seeding and subsequent 30-min incubation in the absence (left) or presence of NNC 55-0396 at the concentration of 5 (middle) and 10 (right) μmol/l. Images acquired under an inverted light microscope with a ×10, 0.30 numerical aperture objective. Bb: cell-matrix adhesion strength is estimated as relative number of attached cells in treated PMVECs relative to untreated control PMVECs (mean ± SE), obtained from 10 to 12 random fields from triplicate Matrigel-coated substratum in a single assay that was replicated 3 times. NNC 55-0396 dose-dependently reduced the number of PMVECs attached to the substratum. One-way ANOVA (F = 114, P < 0.0001) with post hoc Tukey’s multiple comparison test (☆P < 0.001). C: effect of T-type Ca2+ channel blockade or shRNA α1G suppression on cell migration of PMVECs. Ca: representative images of monolayer PMVECs in serum-starved media at 0 and 18 h postscratch in the absence (vehicle control) or presence of NNC 55-0396 (5 μmol/l) during the 18-h interval. Cb: representative images of cell monolayers of scrambled-RNA-transduced PMVECs and α1G-shRNA-transduced PMVECs in serum-starved media at 0 and 18 h postscratch. The images were acquired on a Nikon TS100-F inverted optical microscope with a ×10, 0.30 numerical aperture objective. The lines indicated the boundary of scratch or frontier of gap closure. Cell migration was assessed by area recovery of the scratched gap, measured at time 0 and 18 h in every group. The percentage recovery (closure) of initial scratch area was compared. Cc: quantification results (mean ± SEM) of wound closure from triplicate wells of each cell group in a single assay that was replicated 3 times (*P < 0.0001, Student’s t-test).

