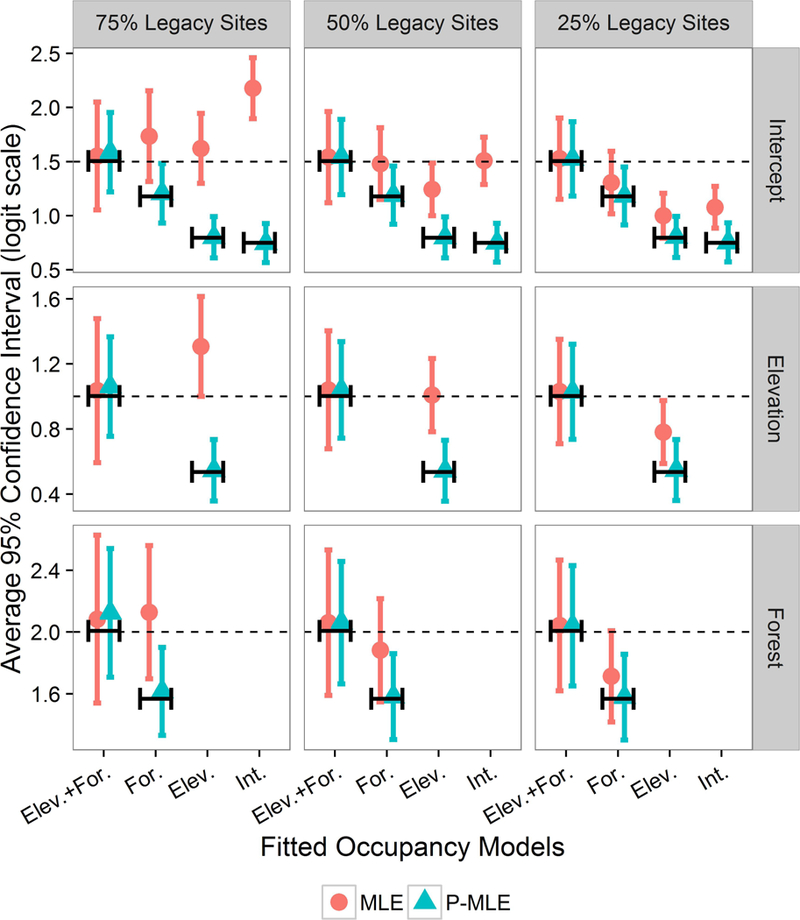
Fig. 3.

Four different fitted model occupancy parameter estimates under different hybrid design scenarios similar to Oregon example. Fitted models varied site-level covariate structures: data generating model with elevation and percent forest (Elev. + For); Forest cover only (For.); elevation only (Elev.); and constant occupancy (Int.). Each legacy scenario is composed of different percentages (75%, 50%, 25%) of non-probability or purposively selected legacy sites and randomly selected sites for a total sample size of 555 and 8 revisits. Occupancy estimation methods were the usual site-occupancy model with maximum likelihood (MLE) versus weighting the log-likelihood by the adjusted sample weights to account for the design (pseudo-maximum likelihood estimates, P-MLE). The dashed lines display data generating values and line segments show model estimates assuming a census was conducted.
