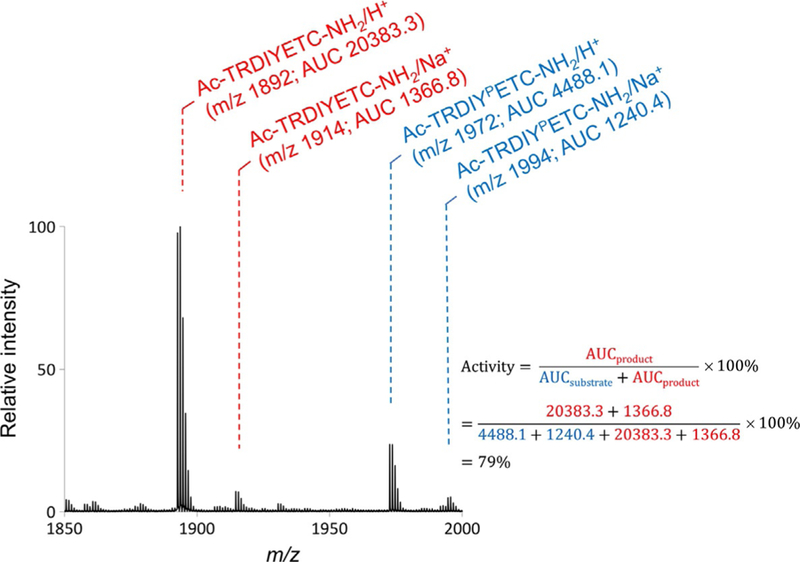
Fig. 5.

Analysis of the mass spectrum to measure phosphatase activity on a peptide. The mass spectrum quantifies the amounts of unreacted phosphorylated substrate and reacted dephosphorylated product. We calculate the area under the curve (AUC) to determine the extent of dephosphorylation of the peptide. The spectra above shows both the substrate and product peaks as well as their integrated areas. To calculate percent activity, we divide the AUC of the product peak(s) by the AUC of both the substrate and product peaks.
