
Fig. 3.
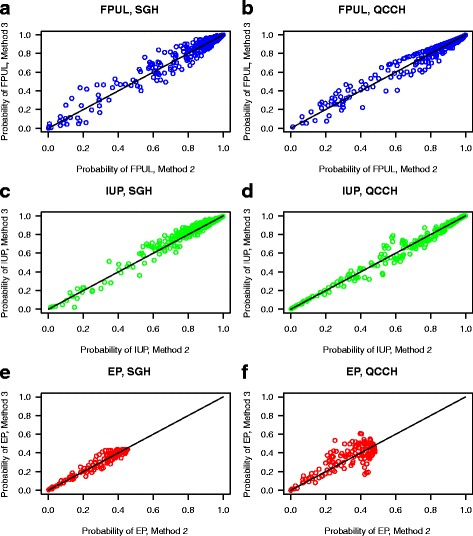
Reclassification plots for logistic recalibration (method 2) vs refitting (method 3) on the temporal (a, c, e) and geographical (b, d, f) updating data: the predicted probability of FPUL when the reference standard is FPUL (a, b), the predicted probability of IUP when the reference standard is IUP (c, d), the predicted probability of EP when the reference standard is EP (e, f)