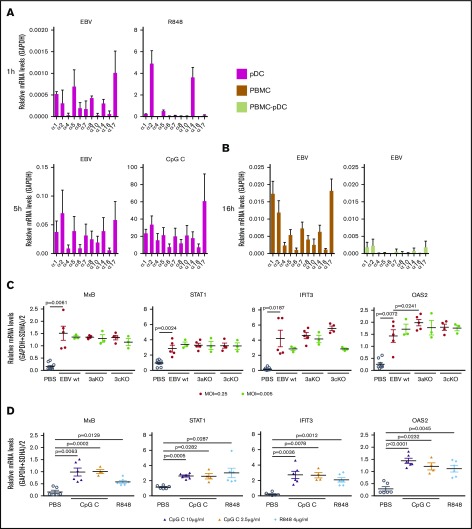
Figure 2.
EBV elicits IFN-α1, IFN-α2, IFN-α5, IFN-α7, IFN-α14, and IFN-α17 preferentially after pDC stimulation in PBMCs. (A) Relative messenger RNA (mRNA) levels of IFN-α subtypes were measured in isolated pDCs exposed to EBV or R848 for 1 hour (n = 2) or to EBV (n = 4 for IFN-α16 and IFN-α17; n = 5 for the other IFN-α subtypes) or CpG C (n = 2) for 5 hours. (B) Relative mRNA levels of IFN-α subtypes were measured on total PBMCs or pDC-depleted PBMCs 16 hours after infection (n = 3). (C) Total PBMCs were exposed to wild-type EBV (wt), EBNA3A-deficient EBV (3aKO), or EBNA3C-deficient EBV (3cKO) for 24 hours. Relative mRNA levels of the ISGs MxB, STAT1, IFIT3, and OAS2 were measured by using quantitative real-time polymerase chain reaction. (D) Total PBMCs were exposed to class C CpG ODN 2395 (CpG C) or R848 for 24 hours. Relative mRNA levels of the ISGs were assessed as in panel D. Paired Student t tests were used for statistical analyses. Glyceraldehyde 3-phosphate dehydrogenase (GAPDH) and succinate dehydrogenase complex flavoprotein subunit A (SDHA) were used to normalize mRNA levels.

