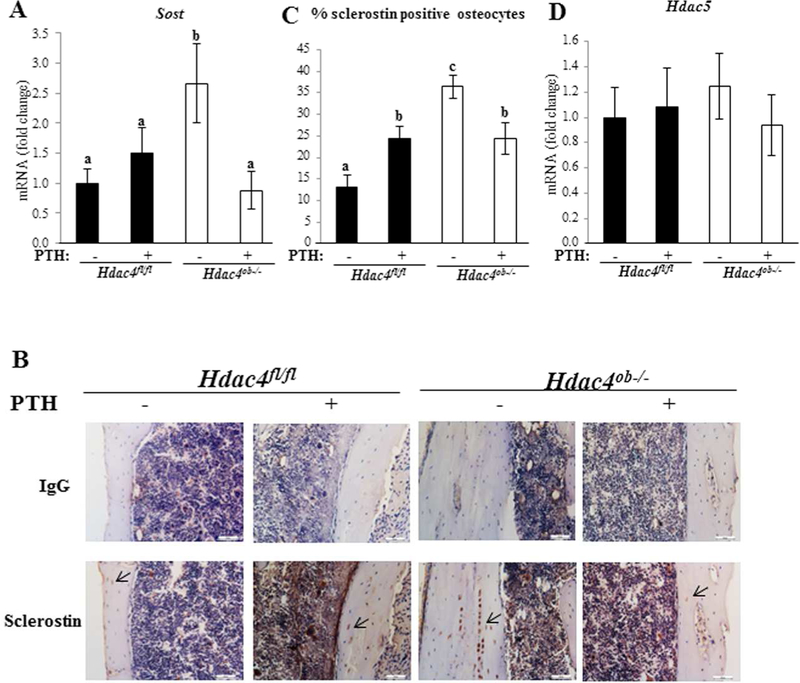
Figure 8. Increased expression of Sost/sclerostin in Hdac4ob−/− mice Sost.
mRNA (A) was measured using real time RT-PCR. The relative levels of mRNAs were normalized to β-actin. Data are shown as means ± SE for –fold change to vehicle-treated Hdac4fl/fl. (Hdac4 fl/fl; n= 9, Hdac4 fl/fl with PTH; n= 9, Hdac4ob−/−; n= 9, Hdac4ob−/− with PTH; n=11). (B) Immunohistochemistry for sclerostin. Representative longitudinal sections of the cortical region of the tibiae. (C) Ratio of number of sclerostin-ositive osteocytes to total number of osteocytes were quantified in lacunae of tibial cortical bones using image J (Hdac4 fl/fl; n=4, Hdac4 fl/fl with PTH; n=4, Hdac4ob−/−; n=8, Hdac4ob−/− with PTH; n=5). Data shown as means ± SE. Different letters indicate p<0.05 vs. one another. Hdac5 mRNA (D) was measured using real time RT-PCR (Hdac4 fl/fl; n= 8, Hdac4 fl/fl with PTH; n= 8, Hdac4ob−/−; n= 8, Hdac4ob−/−; with PTH; n=7). Data are shown as fold change to vehicle-treated Hdac4fl/fl and as means ± SE.

