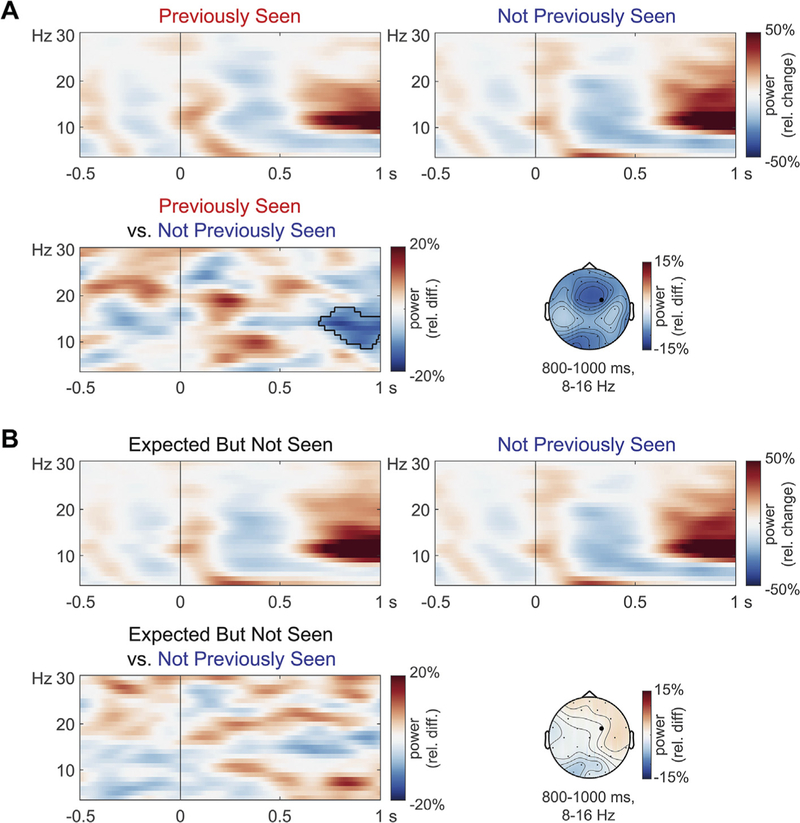
Fig. 5.
Grand-average time frequency representations of power time-locked to final words in the critical sentences, at a right frontocentral channel (RMFr; indicated with a black dot in the scalp maps). The top pairs of spectrograms within each panel show power changes relative to a −500 to −150 ms baseline within each condition. The bottom spectrograms show power differences (relative to the average across all conditions) and their scalp topography. Contour lines indicate cluster extent in permutation tests. A) Repetition effect. B) No pseudo-repetition effect for expected but not presented words.

