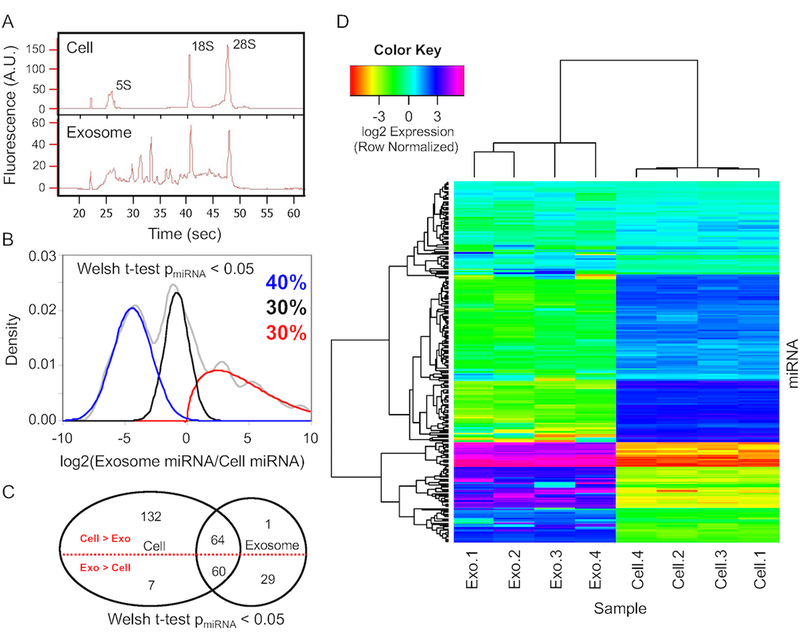
Figure 2: B16F0 exosomes contain miRNAs that are differentially packaged into exosomes relative to parental cells.
(A) The distribution of RNA isolated from parental B16F0 cells (top panel) and B16F0 exosomes (bottom panel) was quantified using microfluidic electrophoresis. (B) The overall distribution in exosome versus cellular abundance of miRNAs (gray curve) was deconvoluted into three normally distributed populations: miR-NAs enriched in cells (blue curve - 40% of total), miRNAs equally distributed between cell and exosomes (black curve - 30% of total), and miRNAs enriched in exosomes (red curve - 30% of total). (C) A Venn diagram summarizes the number of miRNAs that are present above background and are differentially expressed between cell and exosome samples. (D) Hierarchical clustering of miRNA detected above background (Welch t-test p-value < 0.05) from four B16F0 exosomes and four B16F0 cell samples using Affymetrix miRNA microarrays.

