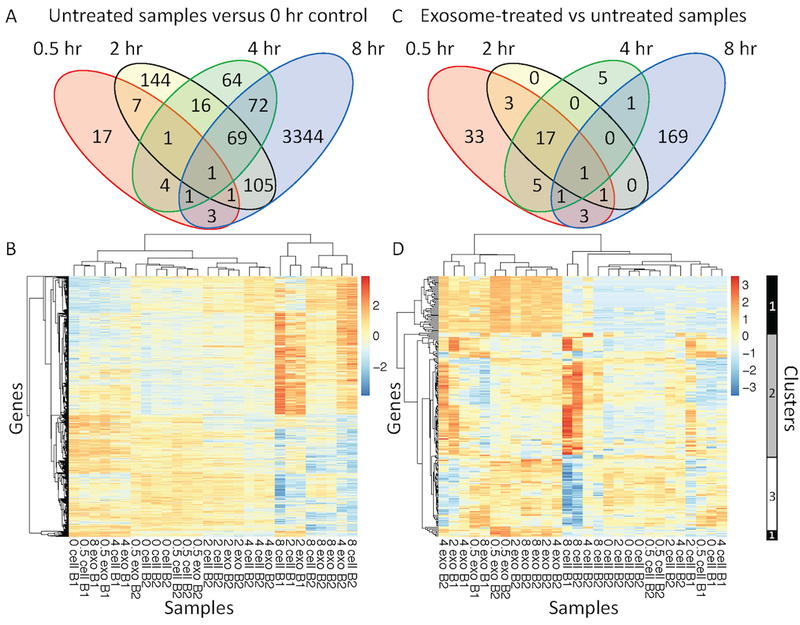
Figure 5: Exosome treatment initiated a different transcriptomic response in CTLL2 cells compared with the transcriptomic changes observed as a function of time.
Venn diagrams of the number of differentially expressed transcripts observed at different time points (A) in untreated CTLL2 cells compared to the 0 hour time point and (C) in exosome-treated versus untreated samples at each time point. Using p-values calculated using the DESeq2 package, a more stringent p-value cutoff was used at the 8 hour time point (p-value < 0.04 ) compared with the 0.5, 2, and 4 hour time points (p-value < 0.1). (B and D) Hierarchical clustering of collection of differentially expressed transcripts detected by RNA sequencing from 28 samples distributed across five time points (0, 0.5, 2, 4, and 8 hour), two experimental conditions (untreated versus exosome treated), and two RNA sequencing batches (B1 and B2). Heatmaps in panels B and D focus on the differentially expressed transcripts summarized in the Venn diagrams shown in panels A and C, respectively. Three clusters of dynamic transcript expression profiles are highlighted on the right margin of panel D. Cluster 1 corresponds to transcripts increased at all time points in exosome-treated samples. Cluster 2 corresponds to transcripts predominantly upregulated in untreated cells compared to exosome-treated cells at 8 hours. Cluster 3 corresponds to transcripts predominantly downregulated in untreated cells and upregulated in exosome-treated cells at 8 hours.

