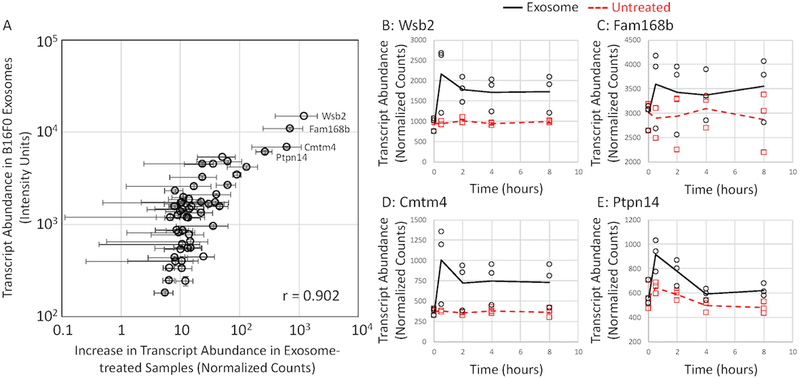
Figure 6: An increase in transcript abundance observed by RNAseq following exosome treatment correlates with mRNA payload contained within B16F0 exosomes as assayed by cDNA microarray.
(A) For transcripts detected above background using cDNA microarray, an increase in transcript abundance in exosome-treated cells over untreated cells after 0.5 hours (mean ± SD, n = 3) was plotted against the average fluorescence intensity for the corresponding transcript probeset assayed by cDNA microarray (mean ± SD, n = 4). A linear relationship was quantified by a correlation coefficient of 0.902. While highlighted in panel A, RNAseq results for four of the most abundance transcripts across experimental conditions (exosome treated: circles and black solid lines, untreated: squares and red dashed lines) are shown separately for Wsb2 (B), Fam168b (C), Cmtm4 (D) and Ptpn14 (E).

