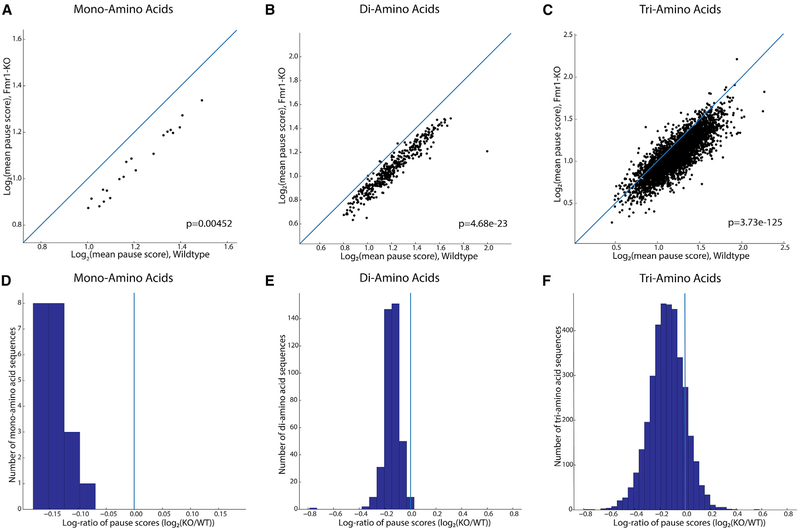
Figure 3. Codon-Level Ribosome Pause Score Analysis of Encoded Amino Acid Sequences across Fmr1-KO and Wild-Type Mice.
(A–C) Log-log plots of mean pause scores calculated for (A) single amino acid, (B) di-, and (C) tri-amino acid sequences in Fmr1-KO and wild-type mice (n = 3 for both genotypes), with accompanying p value for the significance of the difference in these two distributions (Mann-Whitney U test). In each plot, the main diagonal is plotted as a blue line representing equal pausing in either genotype, highlighting the downward shift of the mass of individual sequences’ scores and decrease in pause score in Fmr1-KO mice.
(D–F) This shift is visualized differently in (D)–(F), histograms of the log-ratios of mean pause scores for every (D) mono- , (E) di-, and (F) tri-amino acid motif. The downward or rightward shift in (A)–(C) translates to a leftward shift away from the blue vertical line at x = 0, showing decreased pausing for the majority of encoded amino acid motifs in Fmr1-KO versus wild-type mice.

