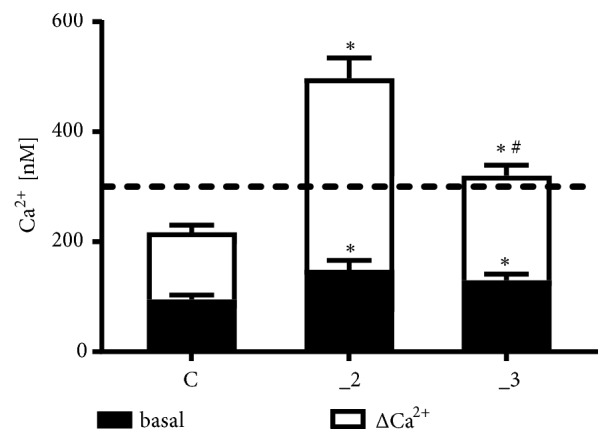
Figure 3.

CCL5 effect on Ca2+ release in PC12 cell lines. The maximal level of [Ca2+]c liberated by 50 ng/ml CCL5 was reached approximately during first seconds after addition of chemokine and was determined as an average of peak values from 5 separate experiments (± SD). Δ[Ca2+]c was calculated by subtracting the resting level (black box) from maximal Ca2+ concentration. ∗ P < 0.05 vs. control line, # P < 0.05 _3 line vs. _2 line (n=5). _2: PMCA2-reduced line, _3: PMCA3-reduced line.
