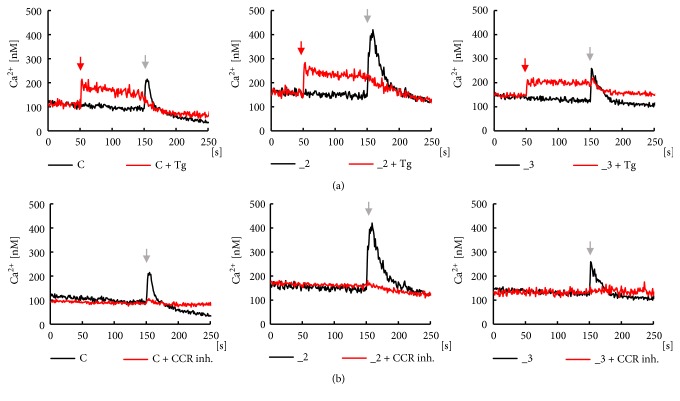
Figure 4.
Analysis of CCL5 effect on calcium transients in PC12 cell lines. Ca2+ transients were measured in parallel wells with (red lines) or without (black lines) presence of specific inhibitors. (a) SERCA inhibitor, 1μM thapsigargin, was added after 50 s (red arrow), and next 50 ng/ml CCL5 was applied after 150 s (black arrow). (b) CCRs inhibitors, 1 nM BX513 for CCR1, 1 μM SB328437 for CCR3, and 1 nM DAPTA for CCR5, were included just before measurements. 50 ng/ml CCL5 was applied after 150 s (black arrow). All measurements were done in duplicate and the presented traces are average from 5 independent cell cultures (n=10). C: control line, _2: PMCA2-reduced line, _3: PMCA3-reduced line.

