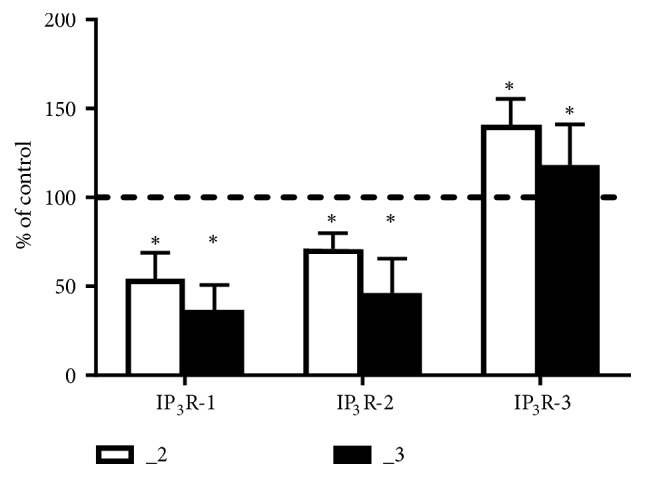
Figure 6.

Real-time PCR analysis of IP3 receptors in PC12 cell lines. A relative fold change (± SD) obtained following normalization to Gapdh expression and calculated using comparative 2−ΔΔCt method. The expression of a target gene in control PC12 cells was taken as 100% and is presented as a dotted line. Statistical differences from values in control are indicated by ∗P < 0.05 (n = 6). C: control line, _2: PMCA2-reduced line, _3: PMCA3-reduced line.
