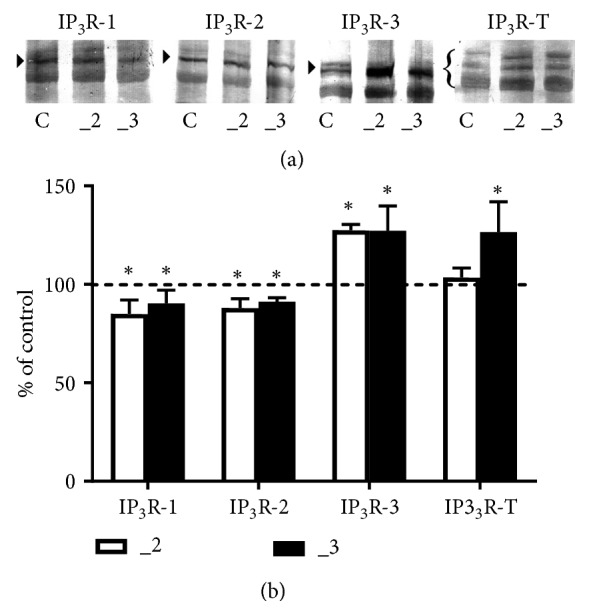
Figure 7.

Western blot analysis of IP3 receptors in PC12 cell lines. (a) Approximately 60–80 μg of total protein was resolved on an 8% SDS-PAGE gel and electroblotted onto nitrocellulose membranes. Membranes were probed with anti-IP3R1, anti-IP3R2, anti-IP3R3, and recognizing all isoforms anti-IP3R-T antibodies. Representative blots are shown and arrows indicate the main band of the receptors. (b) Band intensity was densitometrically analyzed and the results are expressed as % (± SD) of control PC12 cells obtained after normalization to endogenous β-actin level. ∗P< 0.05 (n=7). C: control line, _2: PMCA2-reduced line, _3: PMCA3-reduced line.
