
Figure 4.
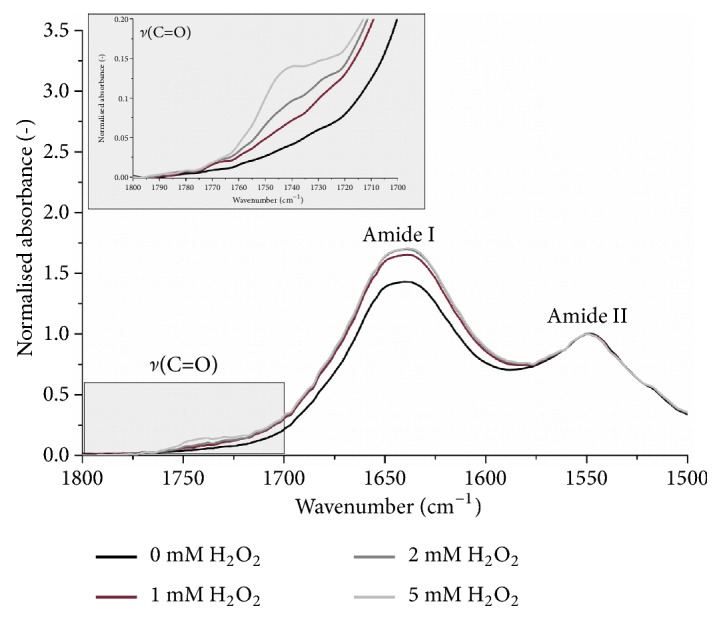
Changes in the FTIR-ATR spectrum of dry blood plasma film due to H2O2 addition: 1800-1500 cm−1 and ν(C=O) band region highlighter.
Official websites use .gov
A
.gov website belongs to an official
government organization in the United States.
Secure .gov websites use HTTPS
A lock (
) or https:// means you've safely
connected to the .gov website. Share sensitive
information only on official, secure websites.
Changes in the FTIR-ATR spectrum of dry blood plasma film due to H2O2 addition: 1800-1500 cm−1 and ν(C=O) band region highlighter.