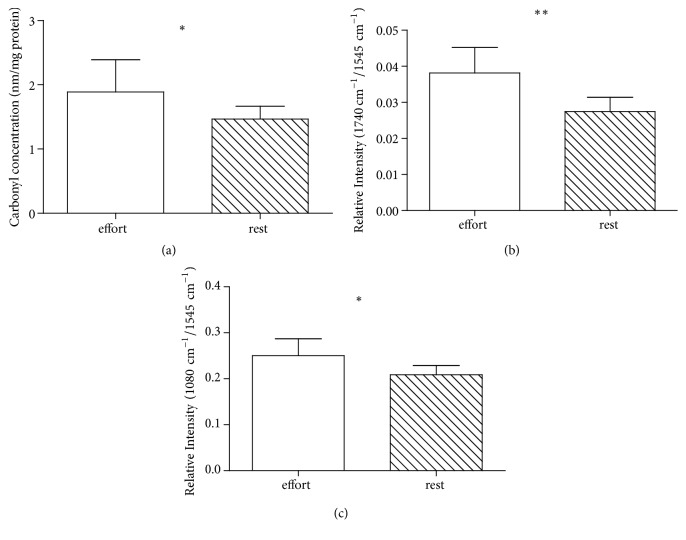
Figure 7.
Changes in the level of carbonylation of plasma proteins in police horses after combat training and after rest measured by the DNPH method (1.89 ± 0.50 and 1.47 ± 0.19, respectively; p = 0.0178) (a) and the FTIR-ATR technique (normalized ʋ(C=O/Amid II)) (0.038 ± 0.007 and 0.027 ± 0.004, respectively; p = 0.0059) (b) Corresponding results of proteins phosphorylation measured by the FTIR-ATR (normalized bands ratio (1080 cm−1/Amid II)) (0.25 ± 0.04 and 0.21 ± 0.02, respectively; p = 0.0343) (c) Data are expressed as the mean (SD) (n = 7). ∗p < 0.05, ∗∗p < 0.01, effort vs rest.

