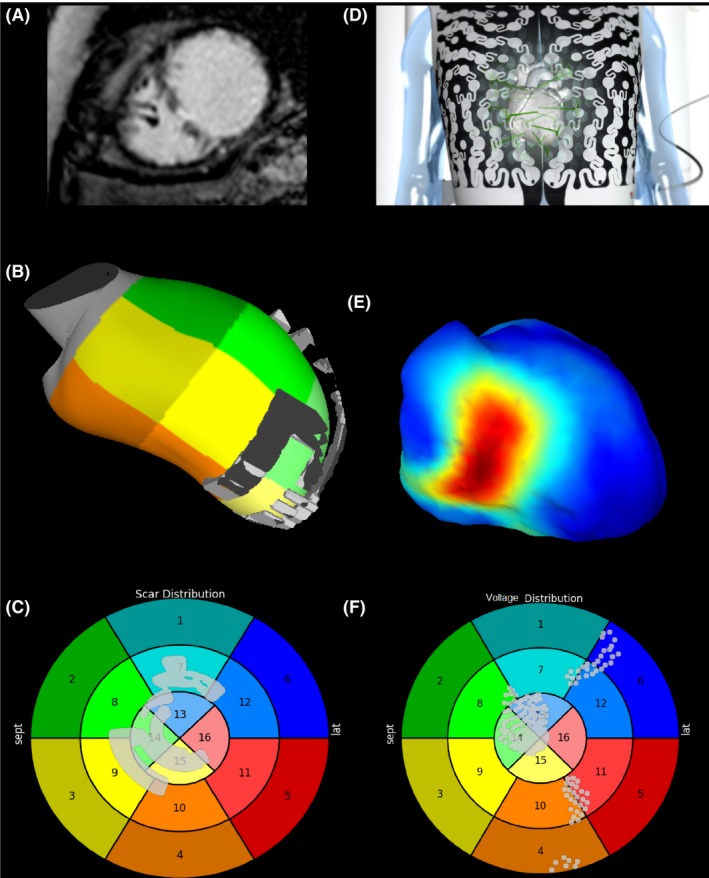
Figure 1.

Multi‐panel plot showing a comparison between late gadolinium enhancement (LGE) derived scar from cardiac magnetic resonance (CMR) and areas of low voltage indicated scarred myocardium. A, LGE CMR in short axis showing areas of transmural hyperenhancement in the mid‐septum. B, Areas of LGE derived scar rendered onto on a 3‐D shell of the LV in RAO angulation. C, Areas of LGE displayed on a 16 segment bulls‐eye plot of the LV. D, The CARDIOINSIGHT ™ electrocardiographic mapping vest is applied to the thorax. E, Voltage thresholded CARDIOINSIGHT ™ electrocardiographic map in RAO angulation. Areas of <2mv are displayed in red. F, Areas of low voltage displayed on a 16 segment bulls‐eye plot of the LV
