Figure 2.

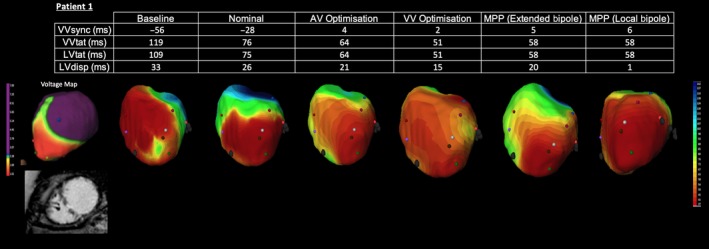
Electrocardiographic activation metrics and directional activation maps during device optimization of Patient 1. A voltage map thresholded to 2mv is shown with a still from the CMR short axis stack (SAX)

Electrocardiographic activation metrics and directional activation maps during device optimization of Patient 1. A voltage map thresholded to 2mv is shown with a still from the CMR short axis stack (SAX)