
Figure 7.
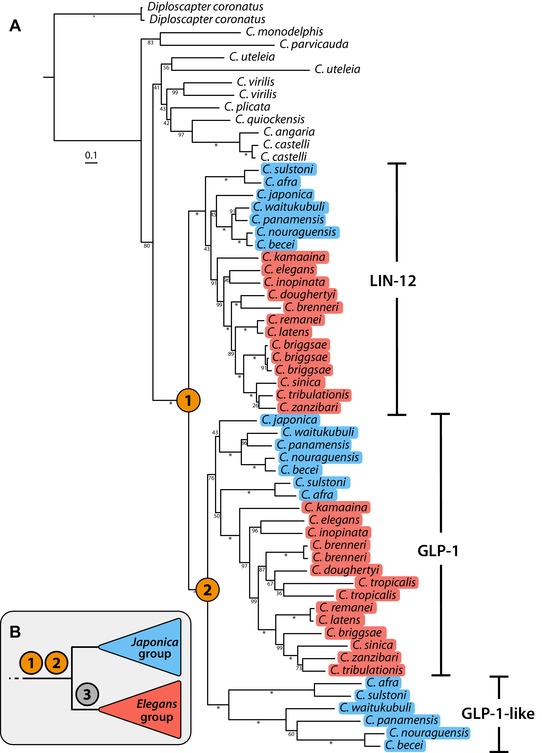
Maximum likelihood gene tree of Notch‐like receptors in Caenorhabditis. (A) Gene tree of the orthogroup containing C. elegans proteins LIN‐12 (CELEG.R107.8) and GLP‐1 (CELEG.F02A9.6) inferred using maximum likelihood (JCCMut+Γ substitution model). Elegans and Japonica groups are highlighted in red and blue, respectively. Duplication events are denoted by orange circles. Branch lengths represent the number of substitutions per sites; scale is shown. Bootstrap values are displayed as branch annotations, “*” = 100. (B) Inferred events: (1) Duplication of ancestral Notch‐like receptor gene; (2) Duplication of glp‐1 gene; (3) Loss of one of the two duplicated glp‐1 genes in the Elegans group.