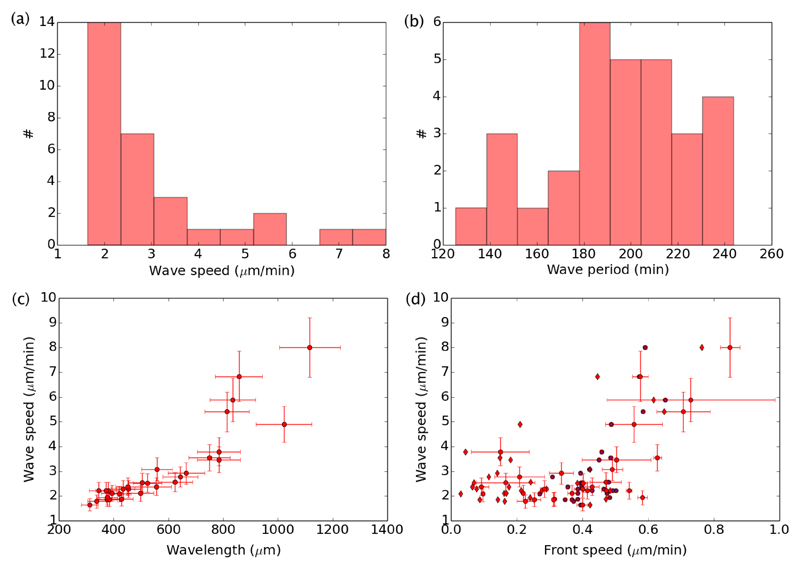
Fig. 8.
Properties of the velocity waves observed in the absence of divisions (# = 30). (a) Histogram of wave speed c. (b) Histogram of wave period Tw. (c) Plot of the wave speed versus the wavelength. Error bars reflect our estimated error on our measurements of c and Tw. (d) Wave speed versus front speed. Dots take into account a front speed averaged on the last five hours of each experiment. The associated horizontal error bars give the standard deviation of this speed over the last five hours. Star symbols take into account the global front speed used in Fig. 3.

