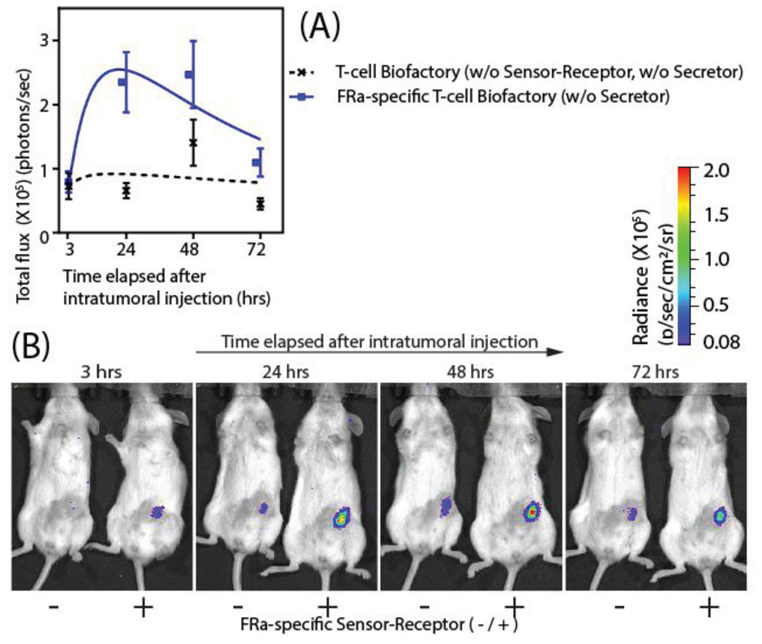
Figure 3.

In vivo validation of the T-cell Biofactory: Two differently engineered T-cell Biofactories (20 million each) [(i) with FRa-specific Sensor–Receptor (+); and (ii) without FRa-specific Sensor–Receptor (−)] were injected intratumorally in the two groups of subcutaneous FRa+ OVCAR3 tumors engrafted in NSG mice (n = 10 per group). The mice were imaged for bioluminescent signal at 3, 24, 48, 72, and 240 h after the intratumoral injection. (see Experimental Section “In vivo study/Bioluminescent imaging” for the complete procedure). Bioluminescence due to Nluc activity was a surrogate to quantify the Effector protein expression. A) Effector protein expression in the FRa-specific T-cell Biofactories upon stimulation by OVCAR3 tumors was similar at 3 h (p = 0.809), when compared to the control T-cell Biofactories without FRa specificity, was most different at 24 h (p = 0.003), and continued to be statistically elevated for at least 72 h (p = 0.014). Signal from the two T-cell Biofactories was found to be statistical similar at 48 h (p = 0.112) and 240 h (p = 0.307). The results were expressed as the mean of bioluminescence emission (photons/seconds) (n = 10 per group, error bar indicates ± 1 SEM). Statistical significance for all comparisons were based on two-sample t-tests with common variance. B) Bioluminescent imaging of mice at the indicated time points (see Figure S4, Supporting Information for all images).
