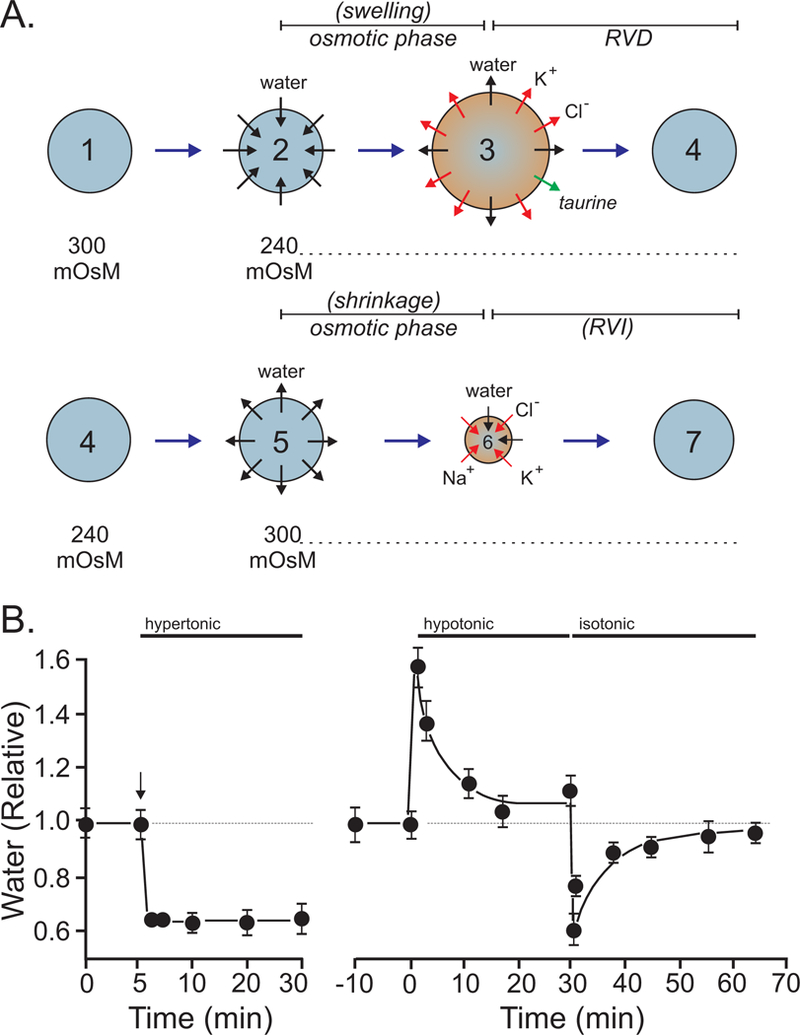
Figure 10. Behavior of mammalian cells exposed to changes in osmolality.

A, After the hypotonic (240 mOsM) swelling (2 to 3) and regulatory volume decrease (3 to 4) phases, the cells are re-exposed to isotonic (300 mOsM) conditions. They then lose water and shrink (5 to 6). This treatment triggers a secondary regulatory volume increase (6 to 7). B, Example of a cell (PC12 cells) undergoing cell shrinkage with no volume recovery when exposed to hypertonic conditions. Upon return to isotonic conditions after regulatory volume decrease, the same cells now demonstrate post-RVD RVI. Redrawn from (Delpire, 1989).
