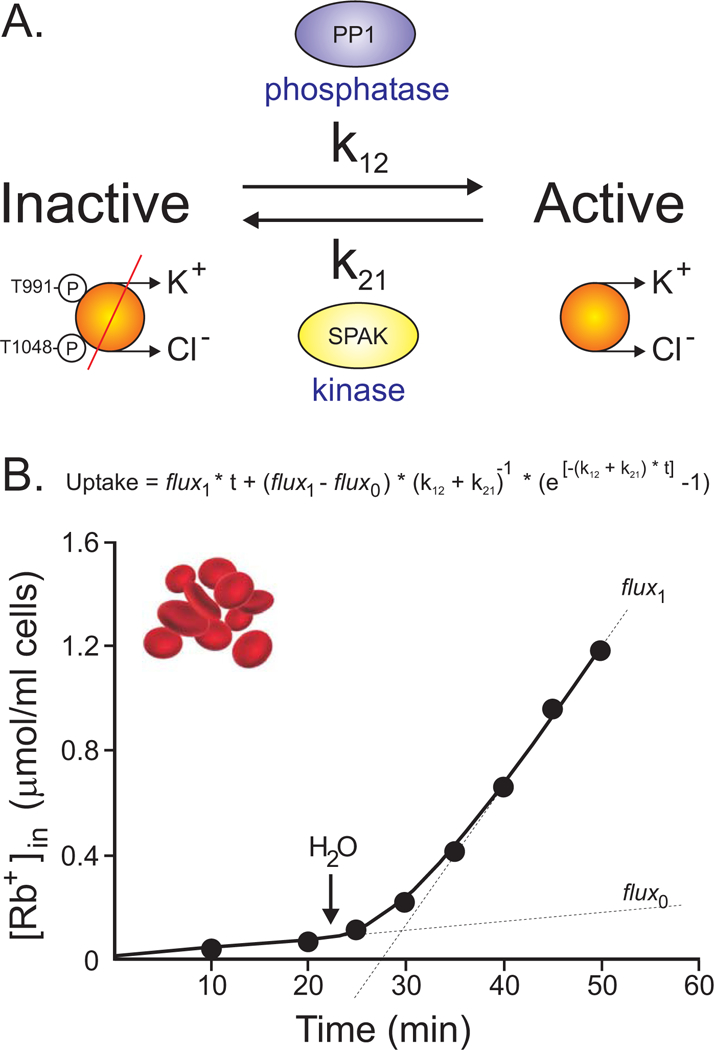
Figure 9. Diagram showing the two-state model of K-Cl cotransport activation/inactivation.

A, A protein phosphatase (PP1) mediates a de-phosphorylation (activation) reaction of specific threonine residues (T991 & T1048) with a rate constant of k12, whereas a kinase (SPAK) mediates the opposite phosphorylation (inhibition) reaction of these same threonine residues with a different rate constant (k21). B, Measurement of 86Rb uptake versus time in rabbit red blood cells illustrates a lag phase occurs in the stimulation of the flux from flux0 to flux1. Water is added at arrow to decrease the medium’s osmolarity. Figure adapted/redrawn from (Jennings & al-Rohil, 1990).
