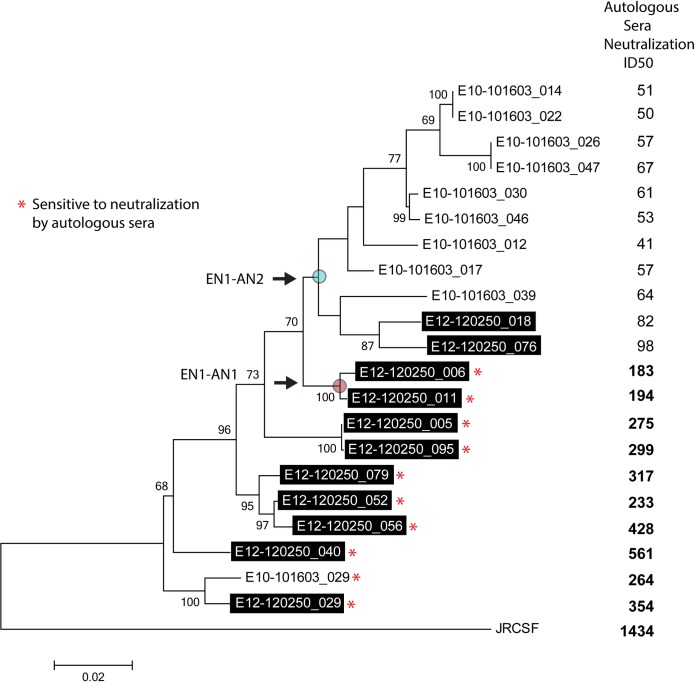
Fig 1. Maximum likelihood (ML) phylogenetic tree tracing the evolution of envelope glycoprotein sequences in EN1.
Data are for provirus gp120 sequences (boxed, shaded labels) and plasma virus sequences showing bootstrap support values exceeding 60% (based on 1000 replicates). Asterisks (*) indicate envelopes sensitive to neutralization by autologous sera. Also shown are neutralization titers (ID50) for each envelope sequence using autologous (EN1) serum. Values in bold represent significant neutralization. The positions of the reconstructed ancestral nodes (EN1-AN1 and EN1-AN2) are indicated as labeled.

