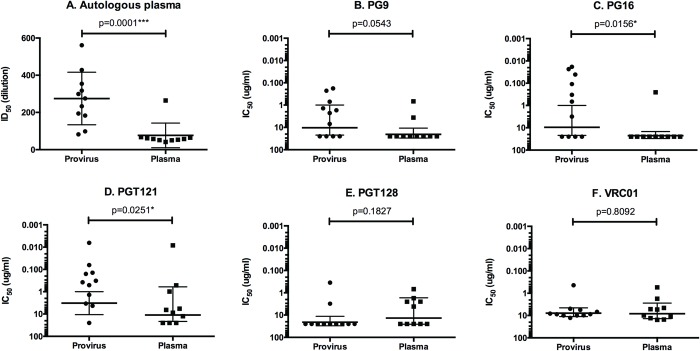
Fig 3. Differences in the sensitivity to neutralization by autologous plasma and bN-mAbs between plasma and provirus derived pseudovirions from EN1.
The virus neutralization data from Fig 2 were plotted as a function of the source of virus (plasma virus RNA or provirus DNA), and the geometric means of titers were calculated. The distributions were compared by unpaired, nonparametric Mann Whitney tests. P values for differences in neutralization titers are indicated.

