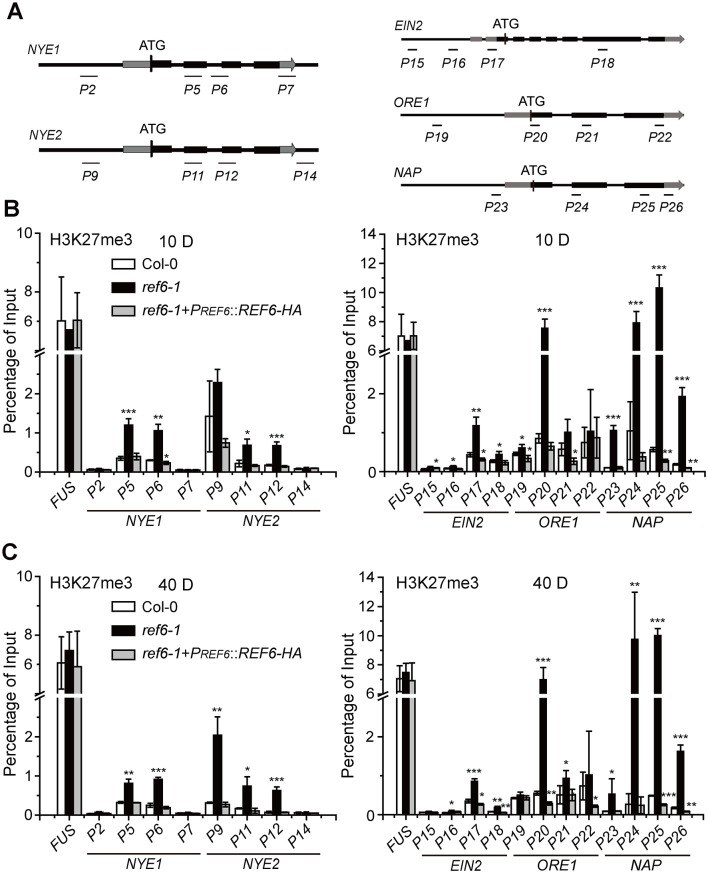
Fig 6. Loss-of-function of REF6 increases H3K27me3 levels at NYE1/2, EIN2, ORE1, and NAP genes.
(A) Schematic diagrams of NYE1/2, EIN2, ORE1, and NAP genes and positions of the primers used for determining their H3K27me3 levels. Primer sequences are listed in S4 Table. (B) H3K27me3 levels of NYE1/2, EIN2, ORE1, and NAP genes, expressed as the percentage of input, in the 10-day-old seedlings of Col-0, ref6-1, and ref6-1+PREF6::REF6-HA grown under long day-growth conditions. (C) H3K27me3 levels of NYE1/2, EIN2, ORE1, and NAP genes in the leaves detached from the 40-day-old plants of Col-0, ref6-1, and ref6-1+PREF6::REF6-HA grown under long day-growth conditions. In (B)—(C), data are mean ± SD (n = 3). *P < 0.05, **P < 0.01, ***P < 0.001 by paired Student’s t test.

