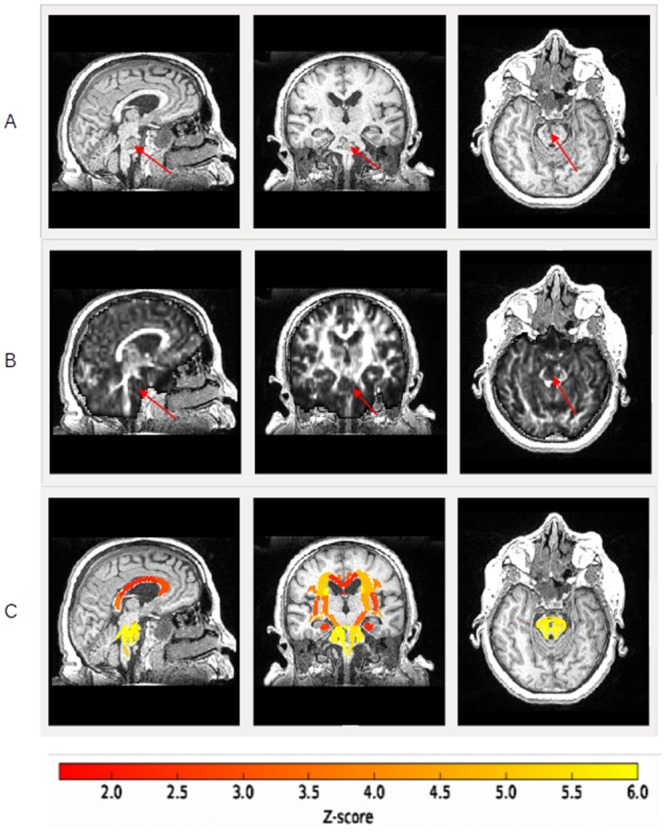
Fig 2. Z-score results.

A: T1-weighted images of a LIS patient (sagittal, coronal and axial slices). Arrows indicate the lesion in the pons. B: FA images (sagittal, coronal and axial slices) of a LIS patient. Arrows indicate the lesion in the pons. C: Example of FA Z-score statistic (absolute values) on T1-weighted images (sagittal, coronal and axial slices) for a LIS patient and for the 48 white matter fiber tracts studied: yellow indicates the highest Z-scores and red the lowest Z-scores (see colour bar just under the image). The patient shows a severe injury at the pons level.
