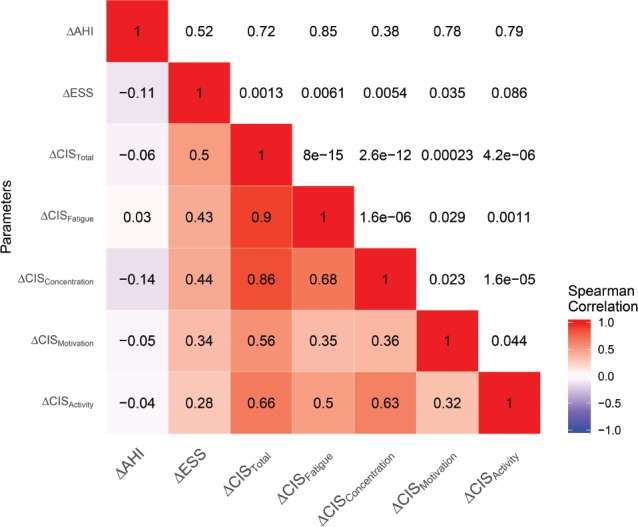
Figure 2. Correlation plot.

The correlations coefficients are shown on the lower left side, and range from −1 to 1. Negative correlations are shown in blue and positive correlations in red. The P values are shown on the upper right side of the correlation plot. Δ = absolute difference between baseline and 3-month follow-up, AHI = apnea-hypopnea index, CIS = Checklist Individual Strength, ESS = Epworth Sleepiness Scale.
